MUSA 550
Geospatial Data Science in Python
Multimodal bike-bus interactions in NYC
What is the relationship between bus arrivals and departures from a metropolitan bus stop in New York City, and the bike-share use in their vicinity? Is there a way to assess the interactions between both systems in order to provide advantages to users that transfer between both systems?
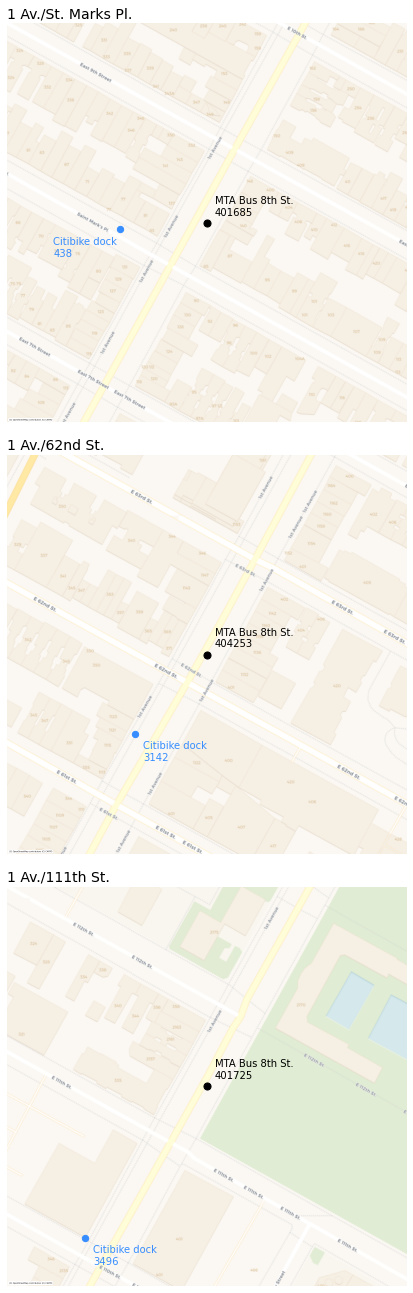
By creating a method to simultaneously retrieve real-time geolocated data from both the New York City’s MTA Bus API and Citi Bike’s Open Data live feed, it is possible to measure the possible interaction between both modes. To do so, three bus stop-bike dock pairs were selected among the same MTA Bus route, the M15 Bus in its northward direction on Manhattan’s First Avenue. These three observed locations had to comply with three conditions in order to obtain relevant conclusions:
- The bus stop-bike dock pair had to be at least three blocks away from any Subway stations.
- The bus stop had to only serve the bus route observed.
- The three locations had to be sufficiently far apart to show different socioeconomic or demographic conditions.
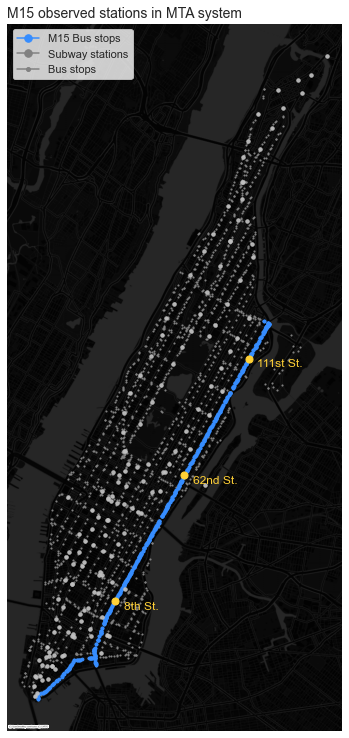
The locations chosen were the 1 Av./St. Mark’s Pl. stop in the more commercial Lower East Side, the 1 Av./62nd St. stop in the affluent Lennox Hill Neighborhood and the 111st St.* stop in the historically disadvantaged East Harlem neighborhood.
The observations for this sample data were obtained at 90 second intervals over a half-hour period on Sunday December 21st 2021. The results retrieved in this time period might have been affected by the surge in COVID cases related to the Omicron variant.
Results
Once the data is retrieved and sorted, it is possible to produce charts comparing the arrival of buses to an specific bus stop and the change in bike availability of its nearby Citi Bike dock, through time and by station.
In the Lower East Side’s 1 Av./St. Mark’s Pl. stop the availability of bikes remained costant and high despite the two incoming bus stoping by.
In the Lennox Hill’s 1 Av./62nd St. stop there were few bikes and a couple of them were checked out within the 3 minues after the bus arrived.
Over at East Harlem’s 1 Av./111st St. stop, bikes appear to have been checked out before and after each bus arrival.
These interactions are also visualized with a map of the bus units on the M15 route at that moment and the corresponding change in bike availability at each location:
Passenger counts
The data retrieved from the coordinated API call also includes an estimated passenger count of each bus unit. The interaction of passenger counts and bike availability can also be visualized as the change in units map that changes in time:
Additionally, we can look for the change in time of the passenger count in each bus (according to its ‘VehicleRef’ unique identifier) and comparte it to the point in time that the bus stopped at one of the observed locations.
Notes
- See the source code that retrieved this information and produced the resulting plots.